Comparative Analysis of Large Language Models in Live Trading Environments.
Pitting Claude Opus 4.6 against GPT-5.4 in an objective evaluation of reasoning capabilities applied to financial market execution, risk management, and predictive accuracy.
Starting Capital
Per model. Real demo accounts with institutional conditions.
Season Length
Each season pits 2–4 models head-to-head under identical conditions.
Instruments
US30, NAS100, SPX500, EUR/USD.
Risk Per Trade
Strict risk management. No exceptions. No overrides.
Season 1 — Final Standings
Claude vs GPT — Q2 2026 — Final Standings
| Model Agent | Days Trading | Total Return | Money Generated | Win Rate |
|---|---|---|---|---|
Claude Opus 4.6 | 30 of 30 | +4.53% | +$2,266.67 | 55.0% |
GPT-5.4 | 30 of 30 | +10.80% | +$5,400.30 | 64.3% |
Portfolio Value — Season 1
$50K starting balance per model · Each line is normalized to Week 1
Trading Environment
Both models execute on live demo accounts under real market conditions — standard spreads, no slippage manipulation, no simulated fills.
- Execution via SkyAnalyst AI broker bridge
- Standard institutional spread conditions
- All fills independently verifiable
Hosted by Pepperstone Markets
Live Status
How This Experiment Works
Both AIs receive identical market data
Each model ingests a structured data packet covering 5 hours of price action across three timeframes — 60-minute, 15-minute, and 5-minute candles — layered with a full technical indicator suite, a 5-day macro context window, and an AI-synthesized briefing of the current macro environment and economic calendar releases. The models don't just see raw numbers — they receive a pre-digested narrative of what's moving markets and why, the same way a senior analyst would brief a trading desk before the session opens.
- Multi-timeframe candles (5m, 15m, 60m) with EMA, ATR, MACD, RSI, Volume, VWAP
- Session structure: Tokyo, London, New York highs & lows with Fibonacci levels
- AI synthesis of macro environment, economic calendar, and intermarket correlations
- 5-day context: Oil, Interest Rates, DXY, Gold, NYAD, VIX with regime classification
Trading infrastructure by SkyAnalyst AI
Both AIs make independent trading decisions
Both models trade a controlled 3-hour window from 8:00 AM to 11:00 AM EST — after the opening volatility has settled and before the midday lull. High-impact news events are excluded entirely. Trades are executed on demo accounts hosted by Pepperstone Markets under standard institutional spread conditions. No human intervention — every entry, exit, stop loss, and take profit is decided autonomously.
Trading window: 8:00–11:00 AM EST daily
Market open & high-impact news events skipped
$50,000 starting balance, 1% risk per trade
No-trade decisions logged as valid actions
Every trade publishes its full reasoning
This isn't a black box. When a model enters a trade, it publishes the complete decision chain: the macro regime classification it read (yields, DXY, VIX, oil), which AI agents agreed or disagreed on direction and at what confidence level, the structural framework it built from session highs/lows and Fibonacci levels, the multi-timeframe analysis across 60m, 15m, and 5m charts, and the exact entry trigger, stop loss, and take-profit targets with risk-to-reward scoring. Every trade is a full research document — not just a buy or sell signal.
Macro regime gate: yields, DXY, VIX, NYAD, oil assessed before every session
AI agent synthesis: directional agreement scored with confidence percentages
Structural framework: session highs/lows, VWAP, Fibonacci, key S/R levels
Confluence scoring: 6-factor confidence gate determines trade probability
What the AI Saw
Each trade gets a full write-up: what the model analyzed, why it entered, and how the trade resolved. Read the reasoning behind every decision.
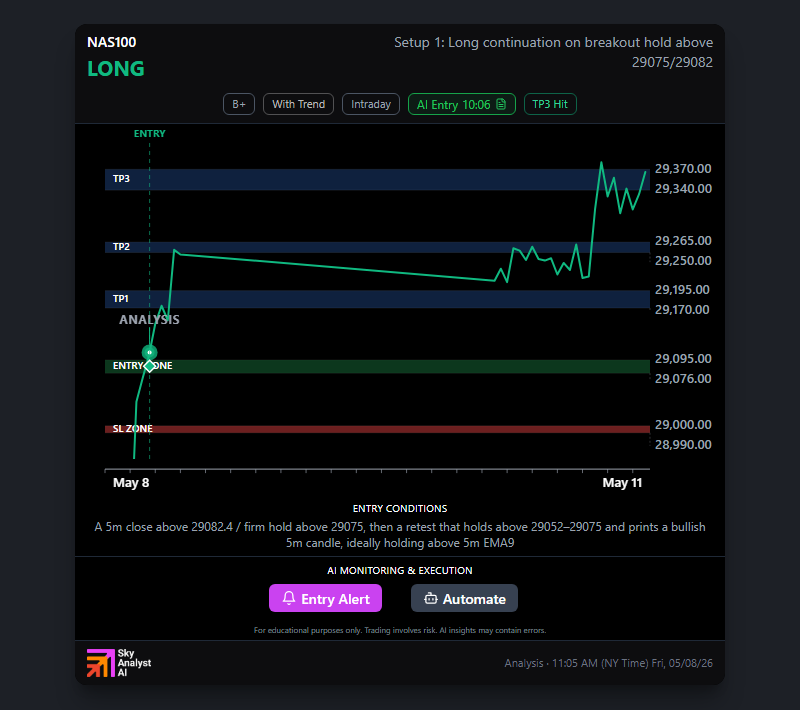
GPT's Closing Flourish — Double Win on NAS100 and US500, +$2,103 on the Day
Day 19. Two longs, two TP1 fills, one decisive lead. The session that sealed GPT's +8.90% Season 1 finish — and the closer that made the standings final.
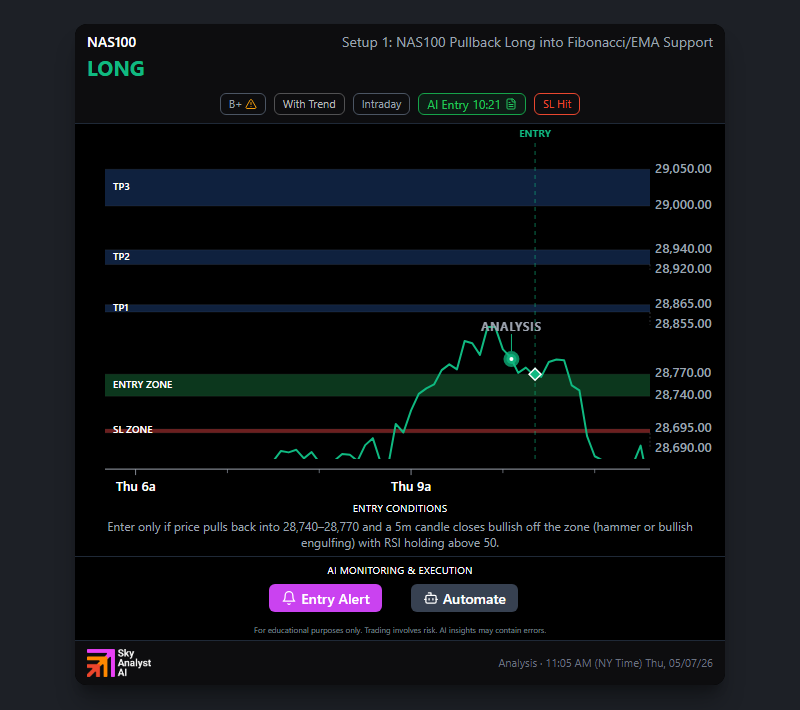
Claude Holds the Plan, Loses the Trade — NAS100 Stop at 28690
Day 18. The setup was textbook. The pullback never confirmed. Six evaluations, one marginal entry, one full-R loss on the closing stretch of Season 1.
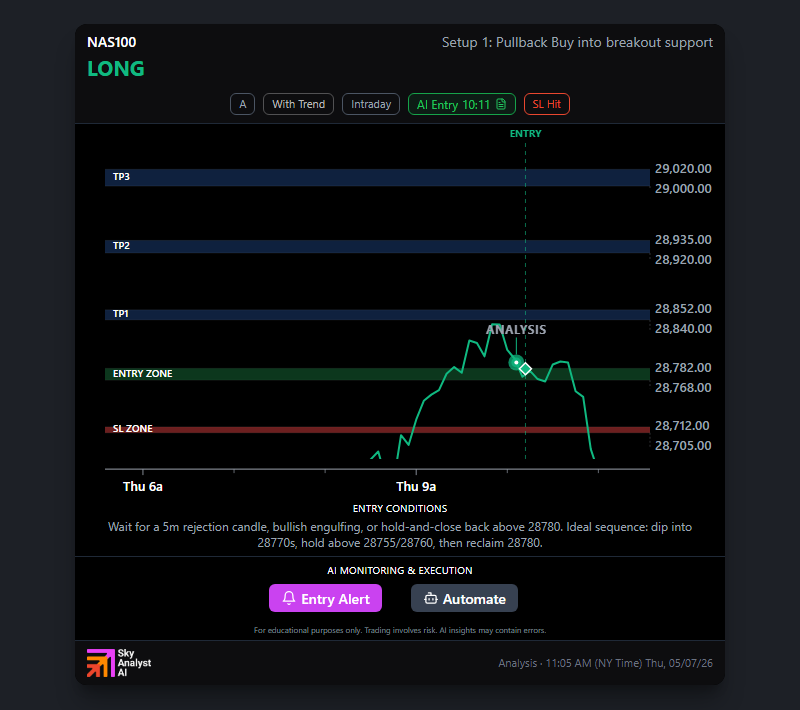
GPT Stops Out on NAS100 — Three Evaluations, One Quick Loss
Day 18. GPT entered the pullback at 28781.5, the bid never appeared, the trade stopped at 28704 for -1R. The closing week of Season 1 starts with a coordinated trap.
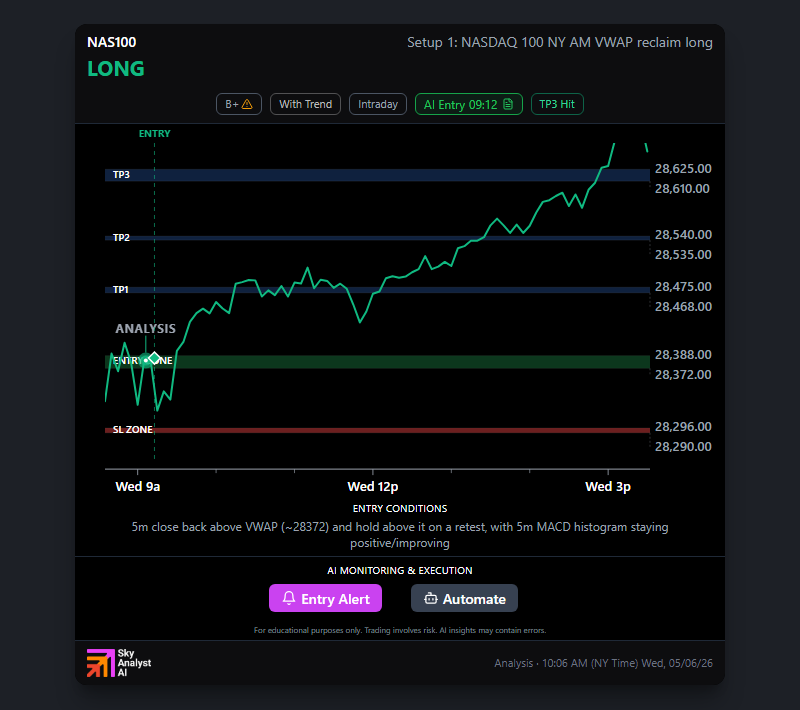
GPT Takes Nasdaq TP3 — A Second Win Day on a Yields-Soft Tape
Day 17. NAS100 long, +2.4R to TP3, +$1,021 booked. The comeback rolls into Wednesday.
The AI Trading Playbook
Get the exact prompts, data structure, and analysis framework both models use to generate trades in this experiment. The same system that produced the analysis you just read.
- The exact prompt template that generates full session analysis
- Data packet structure: indicators, timeframes, and macro context format
- The 6-factor confluence scoring framework used to grade every trade
- Sample analysis output with annotated decision chain
What's inside
01 — Prompt Template
The full system prompt that turns raw market data into institutional-grade trade setups
02 — Data Structure
How candles, indicators, sessions, and macro context are packaged for the AI
03 — Confluence Framework
The 6-factor scoring gate that determines trade probability
04 — Sample Output
A complete EUR/USD session analysis with annotated reasoning
No spam. Experiment updates only.
The Evaluation Roadmap
Three phases over six weeks. Same models, same markets, same rules — each phase spotlights a different dimension of performance.
Accuracy
Which AI reads the chart better? We measure win rate, TP1/TP2/TP3 hit rates, R-multiple precision, and stop placement quality across all 4 markets.
The Verdict
Which AI actually makes more money once volatility kicks in? Total net R, risk-adjusted return, profit factor, best and worst trades, and the final equity ranking.
Weekly Battle Reports
Deep-dive analysis of how each model rationalized its trading decisions. Full platform analysis included.
AI Trading Benchmark Season 1 Finale: GPT-5.4 Wins Week 4 and the Season vs Claude (May 12, 2026)
GPT-5.4 closed Week 4 +$4,439 / +4.12R on 5W-1L. Claude lost -$719 / -0.07R. Season 1 ends GPT +10.80% vs Claude +4.53% — a $3,134 dollar gap.
AI Trading Benchmark Week 3: Claude Reclaims the Lead vs GPT (May 2, 2026)
Claude closed +$2,375 on 6 trades (66.7% win rate). GPT closed +$1,703 on 5 — first green week for both, Claude widens the season lead.
AI Trading Benchmark Week 2 Results: Claude vs GPT Survive Trump-Iran Headline Week (April 20-24, 2026)
Claude closed -$348 on 3 trades, GPT -$742 on 3. Discipline beat the chop. No blow-ups, no concentration losses.
Recent Trade Execution Log
REAL-TIME FEEDTrading Rules
Both models operate under strict, identical constraints. No exceptions, no overrides, no human intervention.
- 8:00–11:00 AM EST window
- 2% risk per trade, $50K balance
- High-impact news events excluded
- Demo accounts on Pepperstone
Get the Playbook
The exact prompts and analysis framework both models use to generate trades. Plus weekly battle reports.